In plain English
Most laboratory papers on peptides report at least one of four numbers: EC50, IC50, Kd or Ki. They look alike, and all are concentrations, but they answer different questions.
- EC50 asks: how much of the compound gives half of its biggest effect in this assay?
- IC50 asks: how much of the compound cuts a signal in half?
- Kd asks: at what concentration is half of the target bound, once binding has settled?
- Ki asks the same question as Kd, but for a compound that competes with another ligand.
EC50 and IC50 are read off a curve and change when the assay changes. Kd and Ki are meant to describe the molecule and its target, so they should travel better between laboratories, but only if they were measured properly [2, 3, 4].
The short version
- A lower EC50, IC50, Kd or Ki means less compound is needed, so the compound is more potent or binds more tightly.
- EC50 and IC50 belong to an assay; Kd and Ki are attempts to describe affinity [1, 3].
- Converting an IC50 to a Ki needs the right equation and the right assumptions [2, 6].
- Check the curve, the units, the incubation time and the concentration of material actually used [4, 5].
The four numbers at a glance
| Term | Full name | What it measures | Depends on assay conditions? |
|---|---|---|---|
| EC50 | Half-maximal effective concentration | Concentration giving 50% of the maximal response of that compound | Yes: cell line, receptor level, readout, time [7] |
| IC50 | Half-maximal inhibitory concentration | Concentration reducing a response or binding signal by 50% | Yes: also depends on substrate or competing-ligand concentration [2] |
| Kd | Equilibrium dissociation constant | Concentration at which half the binding sites are occupied at equilibrium | Should not, if equilibrium is reached and ligand is not depleted [3, 4] |
| Ki | Inhibition (or inhibitor) dissociation constant | Kd of an unlabelled competitor, usually estimated from an IC50 | Should not, if the conversion’s assumptions hold [2, 3] |
The receptor nomenclature committee of the International Union of Pharmacology (IUPHAR) published updated recommendations on terms and symbols in quantitative pharmacology in 2003, revising its 1995 proposals [1]. The NCBI Assay Guidance Manual covers the same quantities from the assay-development side, including Hill slope variations and high-affinity binders [8].
Reading a concentration–response curve
Why the x-axis is logarithmic
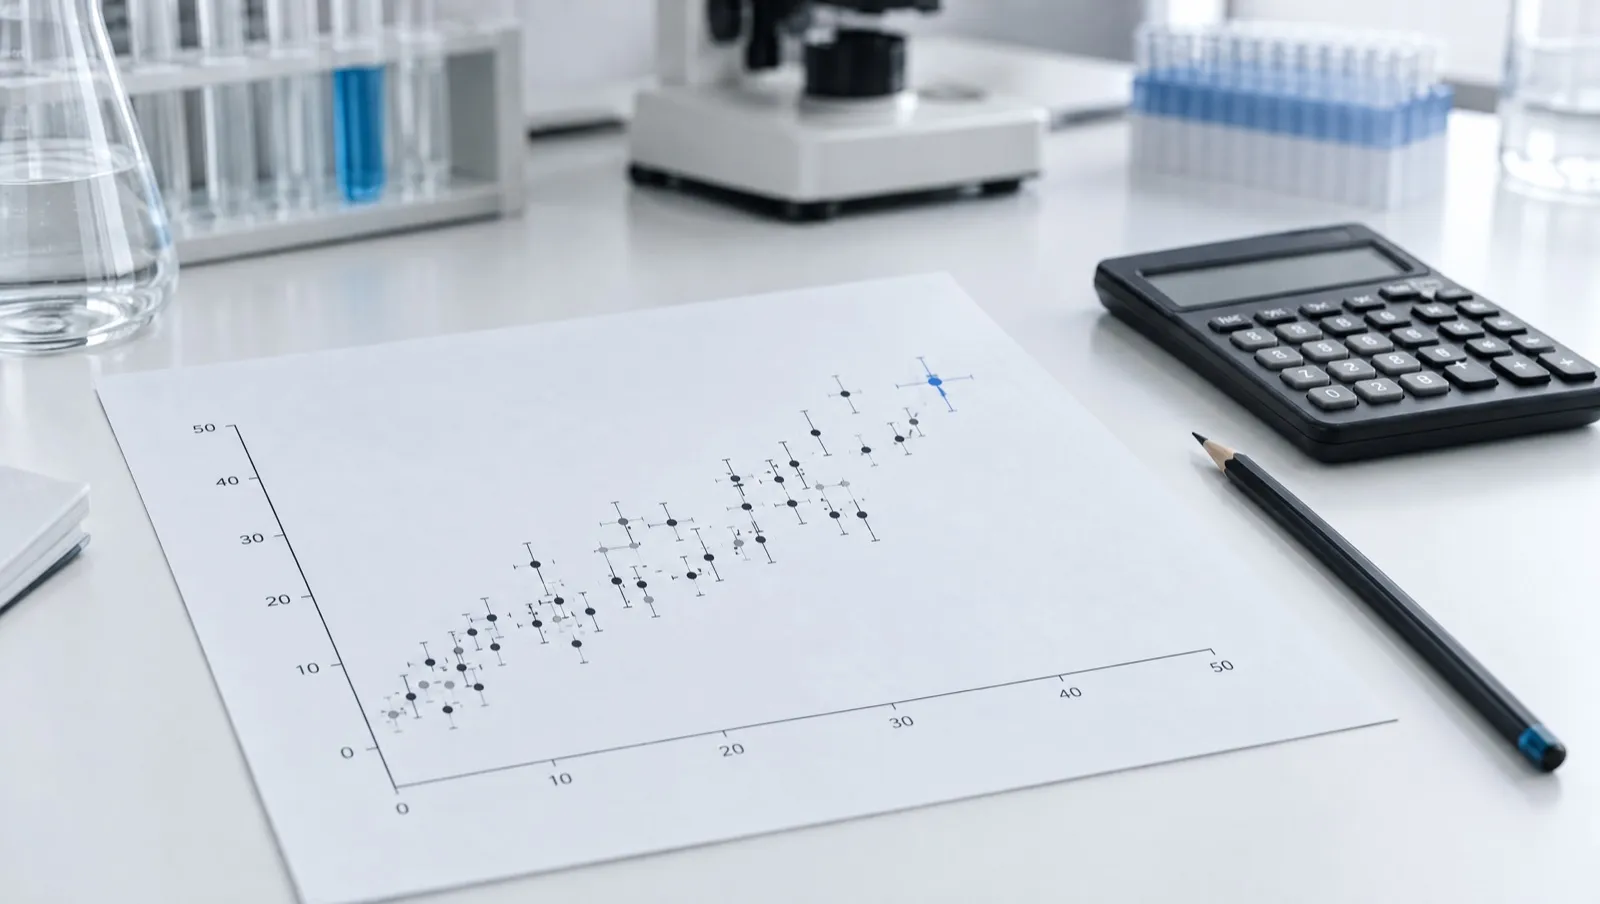
Concentrations in a typical experiment span several orders of magnitude, for example from 0.1 nM to 10 µM. Plotted on a logarithmic axis, the response usually traces an S-shaped (sigmoidal) curve with a lower plateau, a steep middle and an upper plateau.
The four-parameter logistic model
Most papers fit the points with a four-parameter logistic model:
Response = Bottom + (Top − Bottom) / (1 + (EC50 / [A])^h)
Here [A] is the concentration, Bottom and Top are the two plateaus, and h is the Hill slope. Sebaugh describes two ways to define the midpoint [5]:
- Relative EC50 or IC50: the fitted midpoint parameter, halfway between the fitted lower and upper plateaus.
- Absolute EC50 or IC50: the concentration giving a response halfway between the assay’s 0% and 100% controls.
Assays without a stable 100% control must use the relative value [5]. The two definitions can give different numbers from the same data, so a paper should say which one it reports.
When is a fitted EC50 trustworthy?
Sebaugh’s guidelines give a simple test. A relative EC50 or IC50 should be reported only if at least two tested concentrations lie beyond the lower bend of the curve and two beyond the upper bend. An absolute value needs at least two concentrations with predicted responses below 50% and two above [5]. A curve that never reaches its top plateau gives an extrapolated midpoint, not a measured one.
The Hill slope
For simple one-to-one binding, the Hill slope is 1, and occupancy rises from 10% to 90% over an 81-fold range of concentration. Slopes steeper or shallower than 1 are common in real assays. Weiss argues that the Hill coefficient is best read as an “interaction” coefficient reflecting cooperativity, and that it gives the number of binding sites only under the specific condition of marked positive cooperativity [9]. A Hill slope of 2 is therefore not proof of two binding sites.
pEC50 and pIC50
Many papers report the negative base-10 logarithm of the molar value: pEC50 = −log10(EC50 in mol/L). An EC50 of 10 nM (1 × 10⁻⁸ M) is a pEC50 of 8.0. Fitting programs estimate the logarithm directly, so standard errors and confidence intervals are best quoted on the log scale; the statistics behind these intervals are covered in Statistics in Research Papers.
Potency is not efficacy
Potency is about where the curve sits on the concentration axis (its EC50). Efficacy is about how high the curve goes (its maximal response, often called Emax). A compound can be potent but reach only a partial maximum, or weakly potent but reach a full one.
The EC50 of an agonist is also not a direct measure of affinity. In Black and Leff’s operational model, an agonist’s concentration–effect curve is described by three parameters: its dissociation constant (KA), the total receptor concentration, and a parameter for how the agonist–receptor complex is turned into an effect. The ratio of receptor concentration to that transduction parameter, called tau, defines the efficacy of an agonist in a given system [7]. The same peptide can therefore show different EC50 values in two cell lines that express different amounts of receptor. Receptor signalling is introduced in How Peptide Signalling Works, and cell systems in Cell Culture Models Explained.
Kd: measuring affinity directly
Kd is defined at equilibrium. For simple binding it equals the ratio of two rate constants: Kd = koff / kon [4]. At a free ligand concentration equal to Kd, half of the sites are occupied.
Worked example (illustrative numbers)
A labelled peptide binds a receptor with kon = 1 × 10⁶ M⁻¹ s⁻¹ and koff = 1 × 10⁻³ s⁻¹.
- Kd = (1 × 10⁻³) / (1 × 10⁶) = 1 × 10⁻⁹ M, or 1 nM.
- Half-life of the complex = 0.693 / koff = 693 s, about 12 minutes.
- Time to equilibrium. At low concentrations, the approach to equilibrium is governed by koff. Taking the reaction to five half-lives (about 97% complete), as Jarmoskaite and colleagues recommend, needs about 58 minutes [4].
A one-hour incubation is just enough here. A tighter binder with a slower koff would need far longer: Jarmoskaite and colleagues calculate that, with a fast association rate, a 1 pM interaction needs about 10 hours to reach equilibrium, against 40 milliseconds for a 1 µM interaction [4].
Common ways a Kd goes wrong
- No proof of equilibrium. In a review of 100 binding studies, most did not document the controls needed to establish an appropriate incubation time and concentration regime, and several reported affinities could be concluded to be incorrect [4]. The basic test is to show that the bound fraction no longer changes with time [4].
- The titration regime. If the fixed binding partner is present at a concentration well above Kd, the curve reflects titration of that partner rather than affinity [4].
- Ligand depletion. If a large share of the added ligand is bound, the free concentration is lower than the added concentration, which distorts the calculated Kd [3].
- Buffer and temperature. Buffer composition and assay temperature can both change measured affinity and are often overlooked [3]. pH and buffer choice are covered in Buffers and pH for Peptide Work.
From IC50 to Ki: the Cheng–Prusoff equation
An IC50 from a competition experiment depends on how much competing substrate or labelled ligand is in the well. More competitor pushes the IC50 higher. Cheng and Prusoff described the relationship between the inhibition constant and the IC50 for an enzymatic reaction in 1973 [2]. For competitive inhibition, and for competitive binding against a labelled ligand, the commonly used forms are:
- Enzyme assay: Ki = IC50 / (1 + [S] / Km)
- Binding assay: Ki = IC50 / (1 + [L] / Kd)
Here [S] is substrate concentration, Km the Michaelis constant, [L] the labelled ligand concentration and Kd that ligand’s dissociation constant.
Worked example (illustrative numbers). An unlabelled peptide gives an IC50 of 120 nM against a labelled ligand used at 2 nM, whose Kd is 1 nM. Ki = 120 / (1 + 2/1) = 40 nM. As pIC50 and pKi, these are 6.92 and 7.40.
Where the conversion fails
- Only for competitive mechanisms. An extension of standard binding methods can show whether a test ligand acts competitively or allosterically [3]. The simple equation assumes competition.
- Not for functional inhibition curves. Lazareno and Birdsall showed that the usual practice of applying the Cheng–Prusoff correction to functional inhibition curves (a fixed agonist concentration reduced by increasing antagonist) is theoretically invalid, and they described methods based on concentration-ratio analysis instead [6].
- Assay limits. The need for an adequate specific binding signal can set an upper limit on the affinities a given assay can measure [3].
Antagonist affinity: pA2 and Schild analysis
For competitive antagonists in functional assays, the classical approach is Schild analysis. Arunlakshana and Schild set out uses of pAx values, based on the hypothesis that agonists and antagonists compete for receptors according to the law of mass action. They showed how these values can identify agonists acting on the same receptors, compare receptors in different tissues and test whether an antagonism is competitive [10]. A Schild slope close to 1 is consistent with simple competition. Lazareno and Birdsall later showed how to estimate antagonist affinity and Schild slope together by non-linear regression [6].
Beyond equilibrium: residence time
Binding constants describe equilibrium, but some interactions are better described by how long the complex lasts. Copeland and colleagues note that in vitro drug–target interactions are classically quantified with IC50 or Kd, and propose residence time, measured by the dissociative half-life of the complex, as an alternative view in compound optimisation [11]. Two peptides with the same Kd can have very different koff values.
A checklist for reading a reported EC50, IC50, Kd or Ki
- Which quantity is it? EC50, IC50, Kd and Ki are not interchangeable [1].
- Are units and scale stated? Molar units, and whether values are linear or log (pEC50) [1].
- Does the curve reach both plateaus, with at least two points beyond each bend [5]?
- Relative or absolute midpoint? [5]
- What is n, and are confidence intervals given? A single run is one experiment, however many wells it used.
- Was equilibrium shown by varying incubation time [4]?
- For a Ki: which equation, and was the mechanism competitive [2, 3, 6]?
- What concentration of peptide was really used? A lyophilised peptide is not 100% peptide by mass. Water, counter-ions and other non-peptide content mean that a solution made up by weighed mass can hold less peptide than intended, which shifts every apparent potency value. See Peptide Purity vs Peptide Content, Amino Acid Analysis and Laboratory Units and Calculations.
- Was the molecule identified? Mass spectrometry and HPLC data belong in the methods; see How to Read a Peptide Certificate of Analysis.
What this means in Australia
- A potency value is not an approval. An EC50 or Ki from a cell line or membrane preparation is in vitro evidence. It says nothing about whether a substance may be supplied in Australia. The TGA states that unapproved peptide products have not been assessed by the TGA for safety, quality or effectiveness, and that a “research use only” disclaimer does not make supply lawful [12].
- Check the register. Products on the Australian Register of Therapeutic Goods can be looked up in the TGA’s ARTG search [13]; see What Is the ARTG?.
This is general information, not legal advice. Laws change; check the current Poisons Standard and TGA guidance.
Frequently asked questions
What is the difference between EC50 and IC50?
EC50 is the concentration giving half of a compound’s maximal effect; IC50 is the concentration that reduces a response or signal by half. EC50 is used for activators and IC50 for inhibitors, and both depend on assay conditions [1, 5].
Is a lower IC50 better?
A lower IC50 means less compound is needed to reduce the signal by half in that assay, so the compound is more potent there. It does not show that the compound is more selective, more effective at its maximum, or potent in a different system [2, 7].
What is the difference between Kd and Ki?
Both are equilibrium dissociation constants. Kd usually refers to a ligand whose binding is measured directly; Ki refers to an unlabelled competitor whose affinity is inferred from how it displaces another ligand [1, 3].
What does the Cheng–Prusoff equation do?
It converts an IC50 from a competition experiment into a Ki by correcting for the concentration of substrate or labelled ligand. It assumes a competitive mechanism and should not be applied in the usual way to functional inhibition curves [2, 6].
What does a Hill slope above 1 mean?
It means the response rises more steeply than simple one-to-one binding predicts, often reflecting cooperativity. It does not by itself give the number of binding sites [9].
Why do two papers report different EC50 values for the same peptide?
EC50 depends on the cell line, receptor level, readout, incubation time and the true concentration of peptide used. In the operational model, receptor concentration and transduction both shape the curve, so system differences alone can shift the EC50 [5, 7].
References
- Neubig RR, Spedding M, Kenakin T, Christopoulos A. International Union of Pharmacology Committee on Receptor Nomenclature and Drug Classification. XXXVIII. Update on terms and symbols in quantitative pharmacology. Pharmacol Rev. 2003;55(4):597–606. doi:10.1124/pr.55.4.4. PMID: 14657418
- Cheng Y, Prusoff WH. Relationship between the inhibition constant (K1) and the concentration of inhibitor which causes 50 per cent inhibition (I50) of an enzymatic reaction. Biochem Pharmacol. 1973;22(23):3099–3108. doi:10.1016/0006-2952(73)90196-2. PMID: 4202581
- Hulme EC, Trevethick MA. Ligand binding assays at equilibrium: validation and interpretation. Br J Pharmacol. 2010;161(6):1219–1237. doi:10.1111/j.1476-5381.2009.00604.x. PMID: 20132208
- Jarmoskaite I, AlSadhan I, Vaidyanathan PP, Herschlag D. How to measure and evaluate binding affinities. eLife. 2020;9:e57264. doi:10.7554/eLife.57264. PMID: 32758356
- Sebaugh JL. Guidelines for accurate EC50/IC50 estimation. Pharm Stat. 2011;10(2):128–134. doi:10.1002/pst.426. PMID: 22328315
- Lazareno S, Birdsall NJ. Estimation of competitive antagonist affinity from functional inhibition curves using the Gaddum, Schild and Cheng-Prusoff equations. Br J Pharmacol. 1993;109(4):1110–1119. doi:10.1111/j.1476-5381.1993.tb13737.x. PMID: 8401922
- Black JW, Leff P. Operational models of pharmacological agonism. Proc R Soc Lond B Biol Sci. 1983;220(1219):141–162. doi:10.1098/rspb.1983.0093. PMID: 6141562
- Auld DS, Farmen MW, Kahl SD, et al. Receptor binding assays for HTS and drug discovery. In: Markossian S, Grossman A, Baskir H, et al., editors. Assay Guidance Manual. Bethesda (MD): Eli Lilly & Company and the National Center for Advancing Translational Sciences; 2004–. Updated 1 July 2018. PMID: 22553864
- Weiss JN. The Hill equation revisited: uses and misuses. FASEB J. 1997;11(11):835–841. PMID: 9285481
- Arunlakshana O, Schild HO. Some quantitative uses of drug antagonists. Br J Pharmacol Chemother. 1959;14(1):48–58. doi:10.1111/j.1476-5381.1959.tb00928.x. PMID: 13651579
- Copeland RA, Pompliano DL, Meek TD. Drug-target residence time and its implications for lead optimization. Nat Rev Drug Discov. 2006;5(9):730–739. doi:10.1038/nrd2082. PMID: 16888652
- Therapeutic Goods Administration. Understanding your responsibilities when importing, compounding and supplying unapproved peptide products. Safety advisory, 13 April 2026. tga.gov.au. Accessed 25 October 2026.
- Therapeutic Goods Administration. Australian Register of Therapeutic Goods (ARTG) search. tga.gov.au/resources/artg. Accessed 25 October 2026.