In plain English
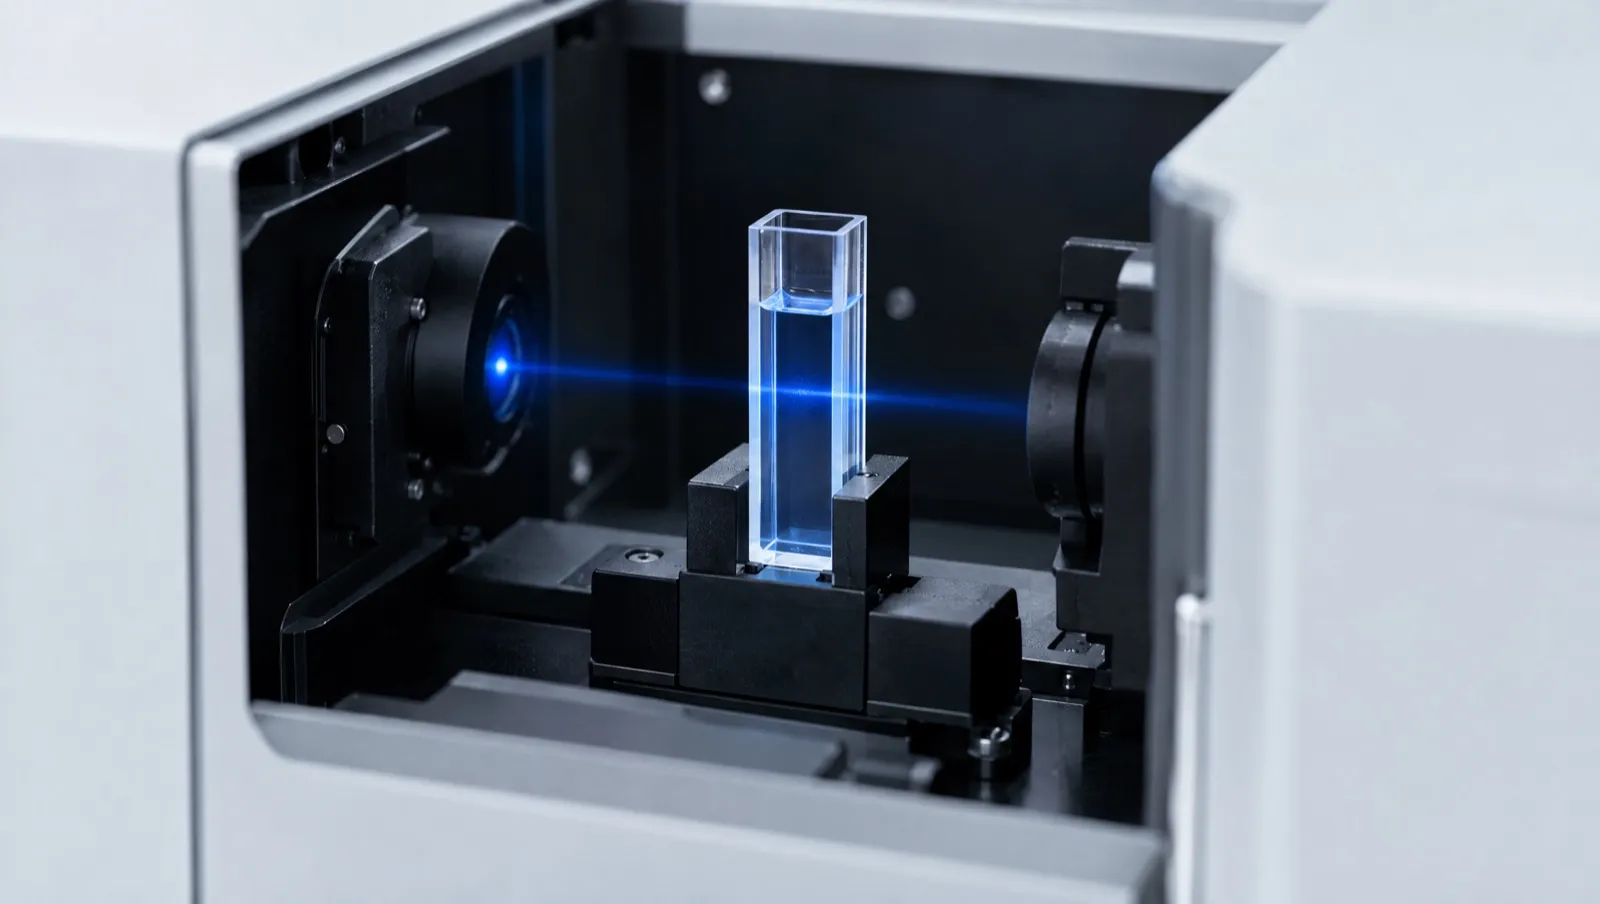
Light can be made to twist as it travels, either to the left or to the right (circularly polarised light). Molecules with a “handedness” (chiral molecules, such as peptides built from L-amino acids) absorb these two kinds of light slightly differently. A CD spectrometer measures that tiny difference across a range of wavelengths [1].
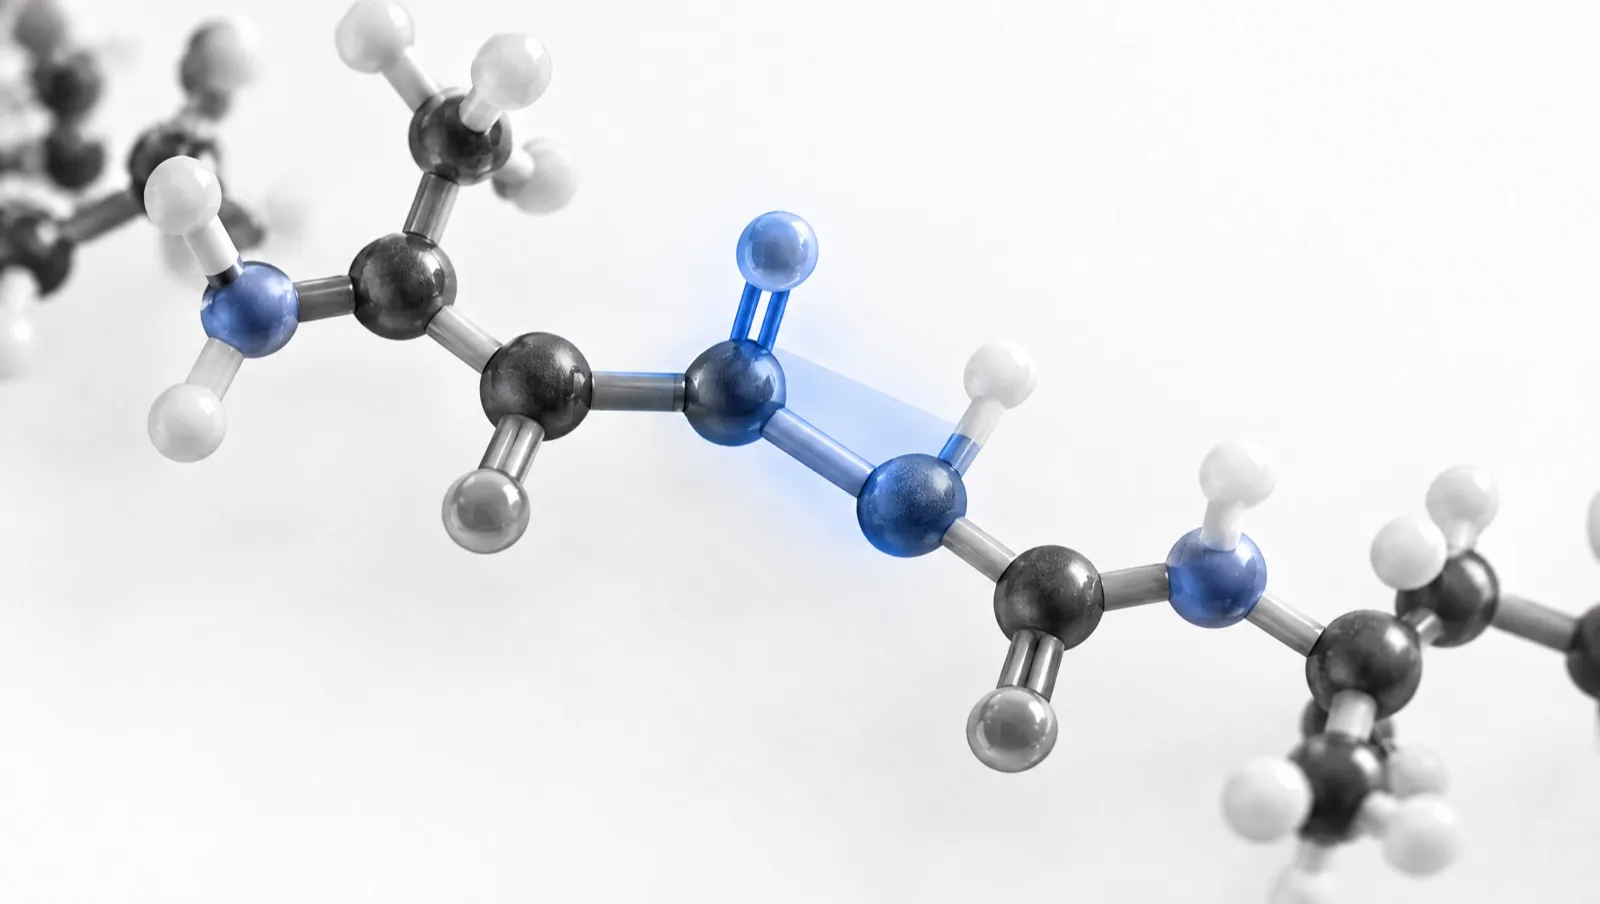
In peptides (short chains of amino acids), the bonds of the backbone absorb in the far ultraviolet. When the chain coils into a helix or lines up into a sheet, the CD spectrum takes on a recognisable shape [1, 2]. A quick CD scan can show whether a peptide is mostly helical, mostly sheet-like or mostly disordered, using only micrograms of material [1].
CD has clear limits. It reports an average over all molecules, so it cannot say which residues form the helix [1]. The calculation also depends on knowing the peptide concentration accurately [1].
The short version
- CD measures a difference in light absorption, reported as ellipticity.
- Far-UV shapes indicate helix, sheet or disorder.
- Accurate concentration is essential.
- CD gives averages, not residue-level detail.
How CD works
CD is defined as the unequal absorption of left-handed and right-handed circularly polarised light [1]. Instruments report the signal either as Δε (the difference in molar absorptivity) or as ellipticity, θ, usually in millidegrees (mdeg). The two are related by [θ] = 3298 × Δε when both are expressed per mole of residue [1].
Two wavelength regions carry different information:
| Region | Approximate range | Chromophores | Reports on |
|---|---|---|---|
| Far UV | ~240–170 nm | Backbone amide (peptide) bonds | Secondary structure [2] |
| Near UV | ~300–260 nm | Aromatic side chains (Phe, Tyr, Trp) | Local tertiary environment of aromatic residues [1, 2] |
In 10 mM phosphate buffer, a protein at 0.05–0.1 mg/mL in a 0.1 cm cell typically gives a signal-to-noise ratio better than 10:1 from 260 nm down to 185 nm [1]. Most peptide work focuses on the far UV.
Far-UV signatures of secondary structure
Each type of secondary structure produces a characteristic far-UV spectrum [1]:
| Structure | Negative bands | Positive band | Notes |
|---|---|---|---|
| α-helix | 222 nm and 208 nm | ~193 nm | The classic two-minimum helix spectrum [1] |
| β-sheet (antiparallel, well defined) | ~218 nm | ~195 nm | β-sheet spectra vary with twist and strand orientation [1, 5] |
| Disordered | ~195 nm | None above 210 nm | Very low ellipticity above 210 nm [1] |
| Polyproline II-like | — | — | Charged polypeptides such as poly-L-lysine at neutral pH, once thought to be random coil, adopt this extended conformation [1] |
Real peptides rarely fall into one class, so analysis software estimates the fraction of each structure type [1]. The diversity of β-sheet spectra was long considered an intrinsic limitation of CD; later work showed it arises from the orientation (parallel or antiparallel) and twist of the sheets [5]. For backbone angles and hydrogen bonding, see Peptide Bonds and Structure.
From millidegrees to mean residue ellipticity
The raw signal depends on how much peptide is in the light path. To compare samples, spectra are converted to mean residue ellipticity, [θ], in deg·cm²·dmol⁻¹ [1]:
[θ] = (θ in mdeg × mean residue mass) ÷ (path length in mm × concentration in mg/mL)
The mean residue mass is the molar mass divided by the number of backbone amide bonds, which is the number of residues minus one for a peptide that is not N-terminally acetylated. Greenfield gives about 115 as a typical value for proteins, but recommends calculating it directly when the sequence is known [1].
Worked example
A 20-residue peptide (not acetylated) has a molar mass of 2,200 g/mol. Its mean residue mass is 2,200 ÷ 19 = 115.8.
At 222 nm, a 0.10 mg/mL solution in a 1 mm cell gives θ = −15.0 mdeg.
- [θ]₂₂₂ = (−15.0 × 115.8) ÷ (1 × 0.10) = −17,370 deg·cm²·dmol⁻¹
Now suppose the powder was weighed as 0.10 mg/mL but is only 70% peptide by mass, with the rest water and counter-ions. The true peptide concentration is 0.070 mg/mL:
- [θ]₂₂₂ = (−15.0 × 115.8) ÷ (1 × 0.070) = −24,814 deg·cm²·dmol⁻¹
The same spectrum now indicates a substantially larger helical signal. This is why Greenfield calls correct concentration “the hardest part” of obtaining high-quality CD data. Lowry and Bradford dye assays give different results for different proteins and should not be used for CD; quantitative amino acid analysis is described as the most accurate method [1]. See Amino Acid Analysis and Purity vs Peptide Content.
A useful internal check: if a peptide is monomeric and does not aggregate, spectra recorded at different concentrations and path lengths should give the same mean residue ellipticity. A change with concentration suggests self-association or aggregation [1]. See Peptide Aggregation.
Buffers, salts and solvents
The far-UV region is where many common buffer components also absorb. Buffers for CD must not contain optically active materials and should be as transparent as possible; the total absorbance of sample, buffer and cell should be kept below about 1 [1]. A tutorial review recommends choosing a path length that keeps absorbance below 1.2 at all wavelengths and monitoring the detector voltage (the “HT” signal), above which data become unreliable [2].
| Buffer (with ~0.1 mg/mL protein, 0.1 cm cell) | Approximate lower wavelength limit [1] |
|---|---|
| 10 mM potassium phosphate + 100 mM potassium fluoride | 185 nm |
| 10 mM potassium phosphate + 100 mM ammonium sulfate | 185 nm |
| 10 mM potassium phosphate + 100 mM KCl | 195 nm |
| 20 mM sodium phosphate + 100 mM NaCl | 195 nm |
| Phosphate-buffered saline (PBS) | 200 nm |
| 50 mM Tris + 150 mM NaCl, with DTT and EDTA | 201 nm |
The pattern is clear: chloride-containing buffers lose the lower end of the spectrum, where the helix and disorder bands near 193–195 nm sit, while fluoride or sulfate salts keep the window open to 185 nm [1]. Other practical points from the same method paper [1]:
- DMSO and formamides absorb too strongly to be used.
- Glycerol up to 20% limits measurements to about 200 nm.
- Oxygen absorbs below 200 nm, so degassed water helps.
- Samples should be at least 95% pure and free of particles (filtered or centrifuged).
For choosing a buffer and pH, see Buffers and pH in Peptide Work.
Trifluoroethanol and other co-solvents
Trifluoroethanol (TFE) is transparent to 185 nm and below, but it changes the structure of peptides and proteins [1]. Alcohol co-solvents such as TFE have been used for decades to stabilise structure in peptides, and there is still no single mechanism that explains all their effects [7]. Molecular dynamics simulations of helix, sheet and hairpin peptides in 30% TFE suggested that TFE molecules cluster around the peptide, displace water and create a low-dielectric environment that favours hydrogen bonds within the peptide [8].
In CD studies of four repeating-sequence peptides of 7 to 22 residues, average helix propensity rose steadily from 0 to 25% TFE and then levelled off [9]. The same work set out a framework for extrapolating helix-forming properties measured in TFE–water mixtures back to water [9]. A helix seen in 50% TFE therefore shows what a sequence can do under helix-promoting conditions; it is not evidence that the peptide is helical in buffer.
Analysing a spectrum: DichroWeb, BeStSel and their limits
Software estimates secondary-structure fractions by fitting the measured spectrum against reference spectra of proteins with known structures.
- DichroWeb is an online server that, at launch, offered five analysis algorithms and seven reference databases. It returns calculated structure fractions, a goodness-of-fit value and plots of measured, calculated and difference spectra [4].
- BeStSel (Beta Structure Selection) accounts for the orientation and twist of β-sheets. It reports eight secondary-structure components, including parallel and antiparallel sheet with different twists, and can predict protein fold class [5, 6].
These tools come with caveats that matter for peptides:
- Reference sets are built mainly from proteins. Most reference datasets are of soluble, globular proteins. For an intrinsically disordered protein, analysis gave a poor fit, with a normalised root-mean-square deviation (NRMSD) above 0.1, because the reference data contain few largely disordered proteins [2].
- Peptide-specific references exist. For polypeptides and short protein fragments, Greenfield recommends constrained fitting with polypeptide reference spectra or programs such as CONTIN or K2D [1].
- Check the fit. A goodness-of-fit value and a difference spectrum should accompany any reported percentages [2, 4].
- Design and calibration matter. A methods review warns that the value of many CD studies is compromised by inappropriate experimental design or by inattention to instrument calibration and sample characterisation [3].
What CD cannot tell a researcher
- No residue-level detail. CD does not give the residue-specific information obtainable by X-ray crystallography or NMR [1]. See NMR Spectroscopy for Peptides.
- Ensemble averages. The spectrum sums contributions from every molecule. For two closely related β-peptides in methanol, CD suggested greater helical propensity for one while NMR showed slightly more NOE signals for the other; molecular dynamics showed both could arise from a single conformational ensemble [10].
- Concentration and aggregation. An error in concentration scales every value, and aggregation can change the spectrum shape [1].
- Characterisation, not a release test. The European Medicines Agency’s guideline on synthetic peptides encourages a description of any higher-order structure (for example by NMR and FTIR) and recommends CD or similar techniques as characterisation data, to justify leaving such analysis out of routine control [11].
Checklist for reading a CD result
- Is the concentration method stated (ideally amino acid analysis or a published extinction coefficient)? [1]
- Are the buffer, salt and lowest reliable wavelength given? [1, 2]
- Is the result in mean residue ellipticity, with the mean residue mass shown? [1]
- Were concentration or path length varied to rule out aggregation? [1]
- If structure percentages are given, which algorithm and reference set were used, and how good was the fit? [2, 4]
- Was TFE or another co-solvent used, and at what percentage? [1, 9]
What this means in Australia
- Testing laboratories. NATA accredits Australian testing laboratories to ISO/IEC 17025, the international standard for testing competence, which is a useful signal of method control for any spectroscopy report [12].
- Characterisation is not approval. CD data describe a peptide’s structure in a defined solution. They do not change its regulatory position. Several peptides are named in Schedule 4 (prescription only) and Appendix D, clause 5 (possession without authority is illegal) of the current Poisons Standard (October 2026) [13].
- Labels do not change status. The TGA has stated that a “research use only” disclaimer does not make supply lawful, change regulatory status, permit importation, or remove advertising or supply obligations [14].
This is general information, not legal advice. Laws change; check the current Poisons Standard and TGA guidance.
Frequently asked questions
What does a CD spectrum of a helical peptide look like?
It shows two negative bands, at about 222 nm and 208 nm, and a positive band near 193 nm [1].
Why does concentration matter so much in CD?
Mean residue ellipticity is calculated by dividing by concentration, so a 30% error in concentration gives a 30% error in every value. Greenfield describes amino acid analysis as the most accurate way to measure it [1].
Can phosphate-buffered saline be used for CD?
It can, but PBS limits reliable data to about 200 nm, cutting off the lower part of the helix and disorder bands. Phosphate buffer with fluoride or sulfate in place of chloride allows measurements to about 185 nm [1].
Does a helix in trifluoroethanol mean the peptide is helical in water?
No. TFE promotes helix formation, and helix propensity rises up to about 25% TFE before levelling off. Measurements in TFE need extrapolation before they can be related to water [8, 9].
How accurate are secondary-structure percentages from CD?
They are estimates that depend on the algorithm, the reference set and the quality of the data. A poor fit, such as an NRMSD above 0.1, means the percentages should not be relied on [2, 4].
References
- Greenfield NJ. Using circular dichroism spectra to estimate protein secondary structure. Nat Protoc. 2006;1(6):2876–2890. doi:10.1038/nprot.2006.202. PMID: 17406547
- Miles AJ, Janes RW, Wallace BA. Tools and methods for circular dichroism spectroscopy of proteins: a tutorial review. Chem Soc Rev. 2021;50(15):8400–8413. doi:10.1039/d0cs00558d. PMID: 34132259
- Kelly SM, Jess TJ, Price NC. How to study proteins by circular dichroism. Biochim Biophys Acta. 2005;1751(2):119–139. doi:10.1016/j.bbapap.2005.06.005. PMID: 16027053
- Whitmore L, Wallace BA. DICHROWEB, an online server for protein secondary structure analyses from circular dichroism spectroscopic data. Nucleic Acids Res. 2004;32(Web Server issue):W668–W673. doi:10.1093/nar/gkh371. PMID: 15215473
- Micsonai A, Wien F, Kernya L, et al. Accurate secondary structure prediction and fold recognition for circular dichroism spectroscopy. Proc Natl Acad Sci U S A. 2015;112(24):E3095–E3103. doi:10.1073/pnas.1500851112. PMID: 26038575
- Micsonai A, Wien F, Bulyáki É, et al. BeStSel: a web server for accurate protein secondary structure prediction and fold recognition from the circular dichroism spectra. Nucleic Acids Res. 2018;46(W1):W315–W322. doi:10.1093/nar/gky497. PMID: 29893907
- Buck M. Trifluoroethanol and colleagues: cosolvents come of age. Recent studies with peptides and proteins. Q Rev Biophys. 1998;31(3):297–355. doi:10.1017/s003358359800345x. PMID: 10384688
- Roccatano D, Colombo G, Fioroni M, Mark AE. Mechanism by which 2,2,2-trifluoroethanol/water mixtures stabilize secondary-structure formation in peptides: a molecular dynamics study. Proc Natl Acad Sci U S A. 2002;99(19):12179–12184. doi:10.1073/pnas.182199699. PMID: 12196631
- Luo P, Baldwin RL. Mechanism of helix induction by trifluoroethanol: a framework for extrapolating the helix-forming properties of peptides from trifluoroethanol/water mixtures back to water. Biochemistry. 1997;36(27):8413–8421. doi:10.1021/bi9707133. PMID: 9204889
- Niggli DA, Ebert MO, Lin Z, Seebach D, van Gunsteren WF. Helical content of a β(3)-octapeptide in methanol: molecular dynamics simulations explain a seeming discrepancy between conclusions derived from CD and NMR data. Chemistry. 2012;18(2):586–593. doi:10.1002/chem.201102667. PMID: 22162155
- European Medicines Agency. Guideline on the development and manufacture of synthetic peptides. EMA/CHMP/CVMP/QWP/367182/2025. Adopted 4 December 2025; effective 1 June 2026. ema.europa.eu. Accessed 25 October 2026.
- National Association of Testing Authorities, Australia (NATA). Laboratory accreditation: ISO/IEC 17025. nata.com.au. Accessed 25 October 2026.
- Therapeutic Goods (Poisons Standard—October 2026) Instrument 2026 (F2026L01327). Federal Register of Legislation. legislation.gov.au. Accessed 25 October 2026.
- Therapeutic Goods Administration. Understanding your responsibilities when importing, compounding and supplying unapproved peptide products. Safety advisory, 13 April 2026. tga.gov.au. Accessed 25 October 2026.