In plain English
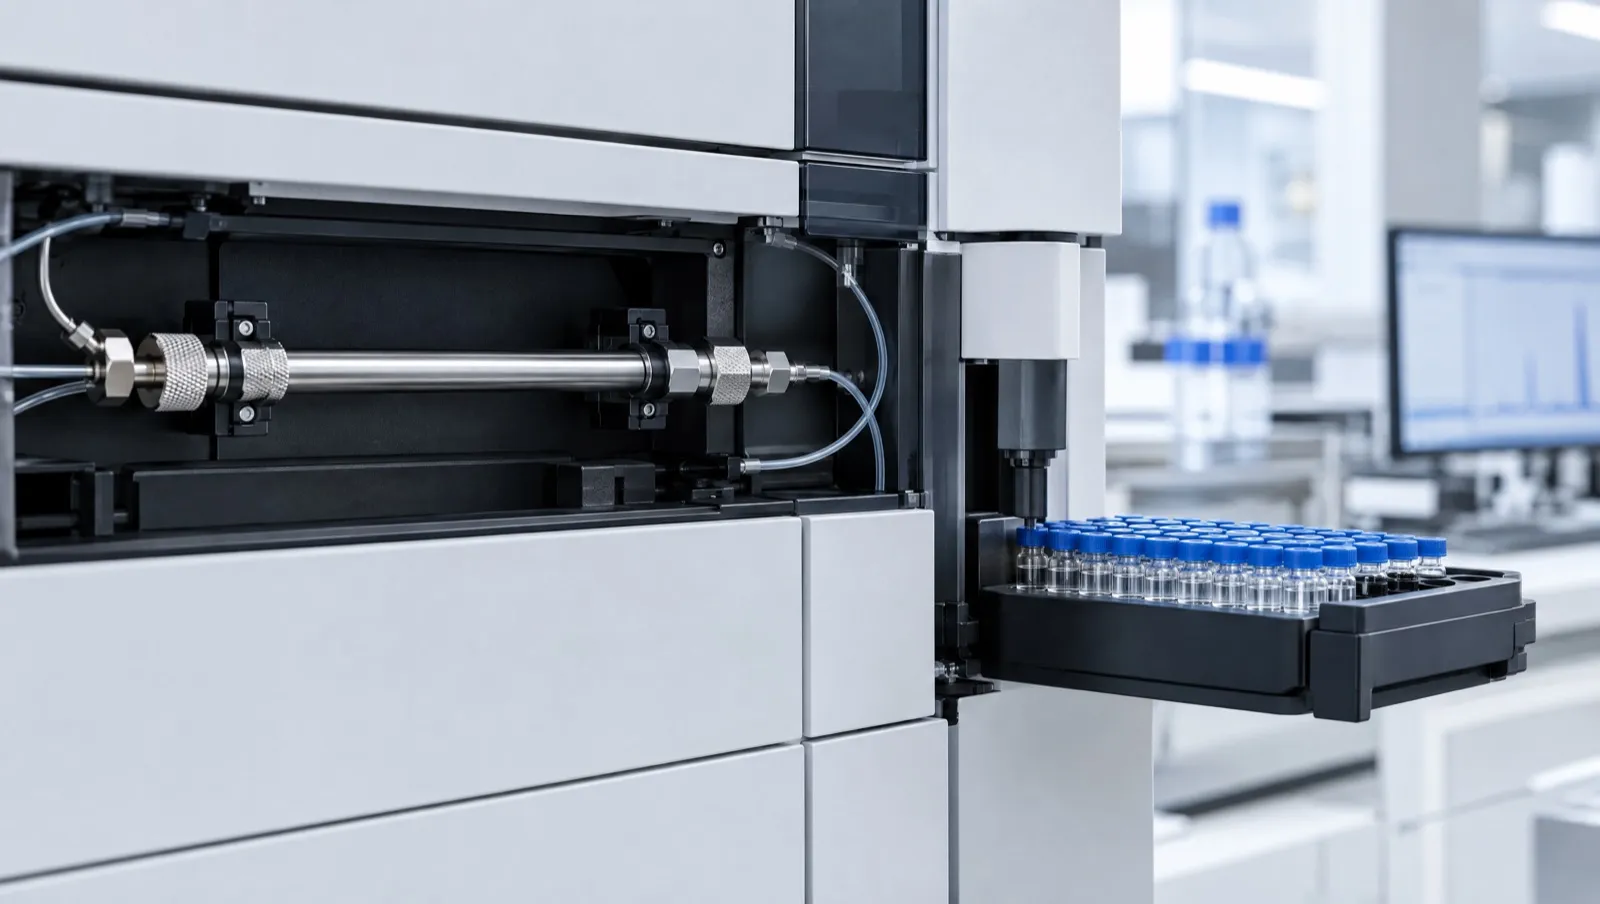
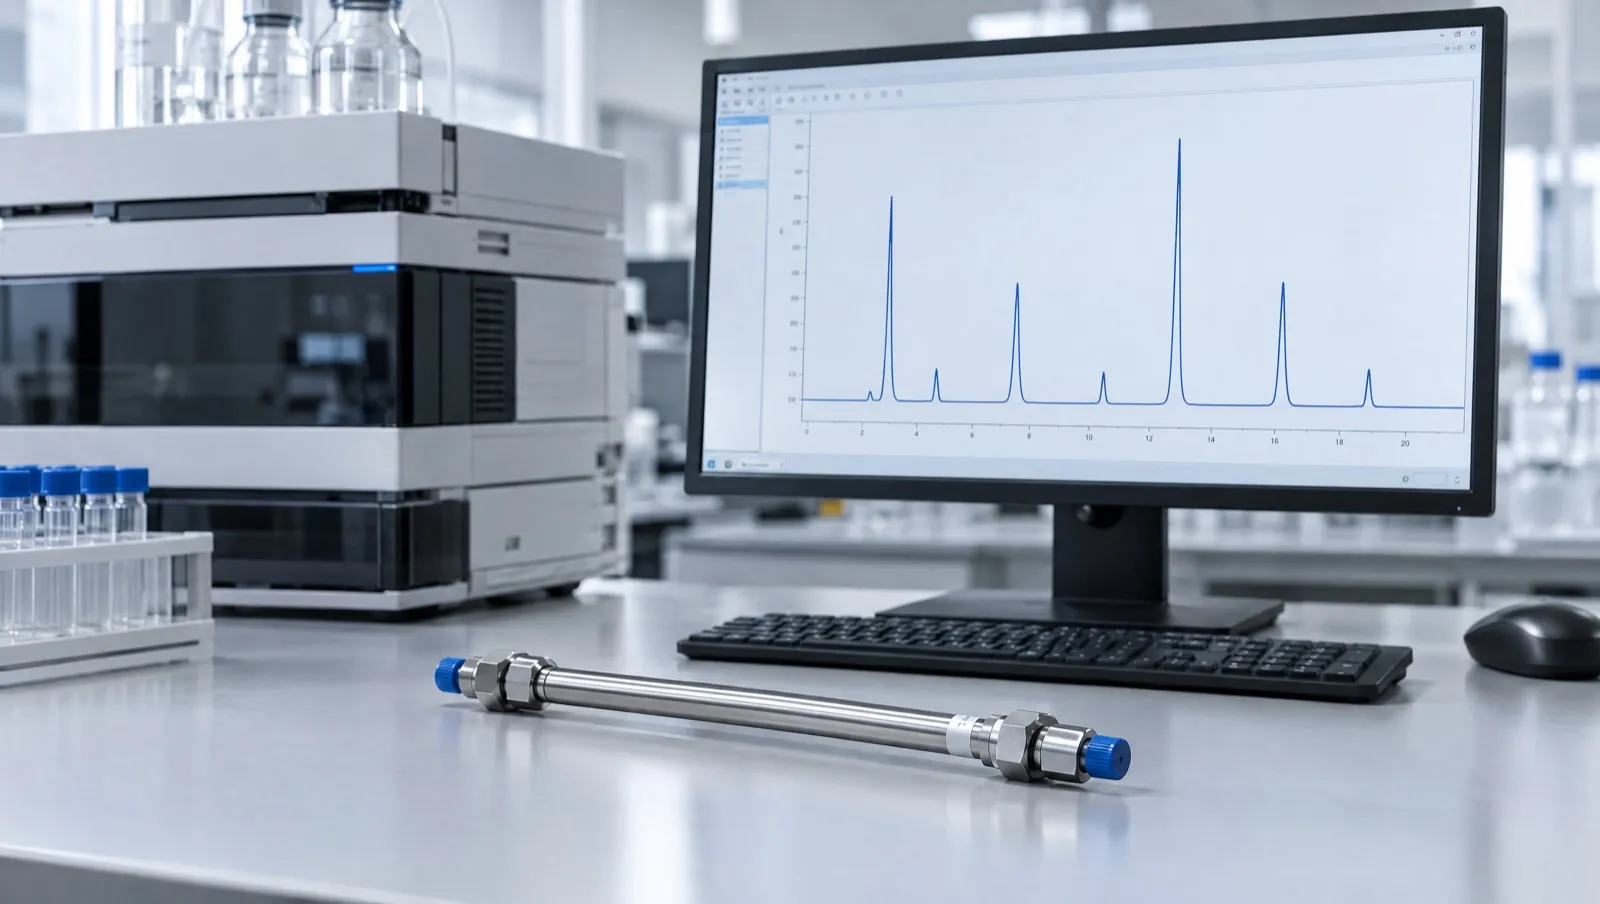
HPLC (high-performance liquid chromatography) separates the parts of a sample by pumping them through a packed tube called a column. Different molecules come out at different times. A detector at the end draws a line called a chromatogram [1].
The bottom axis is time. The side axis is how much light the liquid absorbs, in milli-absorbance units (mAU). Each bump, or peak, is one substance, or sometimes several that came out together [1, 3].
For a peptide, the biggest peak should be the peptide itself. Smaller peaks are usually related impurities, such as chains missing one amino acid [4]. Purity is the main peak’s share of the total peak area.
That number depends on how the software draws the edges of each peak, and on whether every impurity absorbs light as strongly as the main peptide [5, 6]. That is why a good report shows the chromatogram, not only a percentage.
The short version
- Time runs across; signal runs up.
- Purity uses peak area [1].
- Area % assumes every peak absorbs light equally [6].
- One clean peak does not prove identity.
The axes, the baseline and retention time
The x-axis is time, usually in minutes from the moment the sample is loaded. The y-axis is detector response. With a UV detector this is absorbance in mAU. Peptide bonds absorb strongly in the far UV: at 214 nm, each peptide bond has a molar extinction coefficient of about 923 M⁻¹ cm⁻¹, tryptophan absorbs about 30 times more than a peptide bond, and phenylalanine, tyrosine and histidine about six times more [3]. A USP study of peptide reference standards, for example, monitored peptides and impurities at 220 nm [7].
The baseline is the signal when only mobile phase is passing the detector. The first disturbance, near the start, marks material that is not retained by the column. Its time, t₀, is the time the mobile phase takes to pass through the column [1].
Retention time (tᵣ) is the time from sample loading to the top of a peak. It follows tᵣ = (1 + k) t₀, where k is how strongly the compound is held by the stationary phase relative to the mobile phase, so under fixed conditions each compound has a characteristic retention time [1]. Identity by HPLC alone means matching that retention time with an authentic specimen, or showing the peak shape is unchanged when the two are mixed [1]. Impurities are often described by relative retention time (RRT): their tᵣ divided by the main peak’s tᵣ.
Noise sets the smallest peak that can be seen. The pharmacopoeial signal-to-noise ratio is S/N = 2H/h, where H is peak height and h is the width of the background noise [1]. A ratio of 3:1 is generally accepted for the detection limit and at least 10:1 for the quantitation limit [2].
How area-% purity is calculated
Pharmacopoeias describe both peak-height and peak-area measurement, and the peak area percentage method uses areas: each peak’s area divided by the sum of all recorded peak areas [1]. Peaks from the solvent front and peaks that also appear in a blank run are not part of the sample and are excluded.
Worked example (illustrative numbers):
| Peak | tᵣ (min) | RRT | Area (mAU·s) | Area % |
|---|---|---|---|---|
| Impurity 1 | 6.80 | 0.55 | 9.8 | 0.40 |
| Main peptide | 12.30 | 1.00 | 2,436.0 | 98.68 |
| Shoulder impurity | 12.62 | 1.03 | 18.7 | 0.76 |
| Impurity 3 | 14.90 | 1.21 | 4.2 | 0.17 |
| Total | 2,468.7 | 100.00 |
Purity = 2,436.0 ÷ 2,468.7 × 100 = 98.68%.
This assumes every impurity gives the same UV signal per unit mass as the main peptide. The Japanese Pharmacopoeia notes that accurate proportions need each component’s area corrected by its response factor relative to the principal component [1]. ICH Q2(R2) says a correction factor should be applied when a relative response factor falls outside 0.8–1.2 [2]. Assuming a factor of 1 for every peptide impurity can over- or underestimate impurities [6]. Composition is the reason: an impurity that has lost or gained an aromatic residue, especially tryptophan, absorbs noticeably differently at 214 nm [3].
How integration settings change the answer
Integration is the step where software decides where each peak starts and ends and where the baseline runs underneath it. Settings such as the detection threshold, the minimum area counted, the expected peak width and the method for splitting overlapping peaks all change the areas [5, 8].
Using the same raw data as the worked example:
| Integration choice | Main peak area % |
|---|---|
| As above: shoulder split from the main peak by a drop line | 98.68% |
| Shoulder not split, so its area is added to the main peak | 99.43% |
| Minimum-area setting raised, so impurity 3 is no longer integrated | 98.84% |
| A peak that also appears in the blank (area 3.0) wrongly included | 98.56% |
The spread is almost a full percentage point from one data file. Published evaluations show why. For baseline-resolved, symmetric peaks, integration errors stayed within about ±1.5% across the data systems tested. In several scenarios with small “rider” peaks on the tail of a large peak, the perpendicular drop method gave errors above 100%, and complex cases needed more analyst intervention [5]. In a systematic simulation of two overlapping peaks, the perpendicular drop method underestimated the minor peak, and its error stayed within 1% only when resolution was at least 1.1 and the minor peak was at least 30% of the pair; the valley-to-valley method performed worst [8].
Reporting thresholds matter too. European guidance expects impurity methods for synthetic peptides to meet the European Pharmacopoeia reporting threshold of 0.1%, so impurity peaks below that level may not appear in a table at all [9]. A report should say which threshold it used.
System suitability: resolution, tailing and plate count
System suitability testing is part of every chromatographic method, and results are not acceptable unless its requirements are met [1]. It usually checks that the system separates the closest-eluting pair of peaks and that replicate runs of a standard agree, normally from six replicates [1]. ICH Q2(R2) also uses the resolution of the two components that elute closest together to demonstrate specificity [2].
| Parameter | Pharmacopoeial formula [1] | What it tells the reader |
|---|---|---|
| Resolution (Rₛ) | 1.18 × (tᵣ₂ − tᵣ₁) ÷ (W₀.₅ₕ₁ + W₀.₅ₕ₂) | Rₛ ≥ 1.5 is complete (baseline) separation |
| Symmetry (tailing) factor (S) | W₀.₀₅ₕ ÷ 2f | 1.0 is symmetric; larger values mean a tail |
| Plate number (N) | 5.54 × (tᵣ ÷ W₀.₅ₕ)² | Column efficiency: how narrow peaks are for their retention |
| Repeatability | RSD of replicate standard responses | Whether the system gives consistent areas |
W₀.₅ₕ is peak width at half height, W₀.₀₅ₕ is width at one-twentieth of the height, and f is the distance from the leading edge to the peak maximum at that height [1].
Worked example. Main peak tᵣ 12.30 min, width at half height 0.12 min; shoulder tᵣ 12.62 min, width 0.13 min. Rₛ = 1.18 × 0.32 ÷ 0.25 = 1.51, just at baseline separation. N = 5.54 × (12.30 ÷ 0.12)² ≈ 58,000. With W₀.₀₅ₕ = 0.30 min and f = 0.13 min, S = 0.30 ÷ 0.26 = 1.15.
Within limits, laboratories may adjust column dimensions, particle size, temperature, mobile-phase composition and pH, ion-pair reagent concentration, flow rate and gradient timing, provided the system still meets its suitability requirements [1]. How a method earns this trust is covered in Analytical Method Validation.
Reversed-phase gradients for peptides
Most peptide purity methods use reversed-phase HPLC on a hydrophobic column, commonly C18-bonded silica, with a gradient of water and acetonitrile containing an acid additive [10, 11]. Trifluoroacetic acid (TFA) forms ion pairs with the peptide. In one mechanistic study, low TFA concentrations gave poorly shaped peaks with a sharp front and a long tail, caused by secondary interactions of the unpaired peptide with the column [10].
Method conditions should be stated in full. One published peptide method, for example, used a C18 column (100 × 4.6 mm, 3 µm particles) at 1.5 mL/min and 25 °C, with detection at 220 nm [7]. Gradient slope and TFA concentration both affect selectivity between closely related peptides [10].
Blanks, ghost peaks and carry-over
A blank run, using the same gradient with no sample, shows which peaks come from the system rather than the sample. Ghost peaks in reversed-phase gradient HPLC have been traced to causes such as plasticiser contamination of the organic solvent and mixing problems in gradient delivery [12].
Carry-over is material from a previous run that appears in the next one. Peptides and proteins can stick in the autosampler and on columns, and dedicated wash steps have been developed to remove them [13]. A blank run straight after a concentrated sample is a simple check.
Shoulders, co-elution and why LC-MS helps
A shoulder or a lopsided peak can mean two components eluting almost together. Complete co-elution is harder: two species under one symmetrical peak. European guidance says additional independent methods may be needed when one method cannot separate all peptide-related impurities, and that when co-eluting impurities appear as one peak, the 1.0% qualification threshold applies to the combined peak [9].
LC-MS adds a mass to each peak, which often reveals what an impurity is, such as a deletion sequence, an oxidised form or a peptide still carrying a protecting group [4, 14]. It has limits: isomers have the same mass as the target peptide [14]. See Reading a Peptide Mass Spectrum and Common Impurities in Synthetic Peptides.
Checklist: reading a chromatogram on a COA
- Identification: sample name and batch number matching the certificate, plus date and data file name.
- Method conditions: column chemistry and dimensions, mobile phases and gradient, flow rate, column temperature, detection wavelength and sample volume.
- Labelled axes with units (minutes; mAU).
- An integration table listing retention time, area and area % for every reported peak, and the reporting threshold [9].
- Blank handling: a blank chromatogram, or a statement of which peaks were excluded.
- System suitability results: resolution, symmetry factor and repeatability [1].
- A separate identity test, usually mass spectrometry; guidance recommends at least two orthogonal identity methods [9].
For the wider report, see How to Read a Peptide Certificate of Analysis and HPLC, LC-MS and UV-Vis.
What this means in Australia
- Pharmacopoeial standards. For medicines, the Therapeutic Goods Act 1989 defines monographs in the British Pharmacopoeia, European Pharmacopoeia and United States Pharmacopeia–National Formulary as standards [15]. The system suitability terms used above come from pharmacopoeial chromatography chapters [1].
- Accredited testing. NATA accredits Australian laboratories to ISO/IEC 17025 for the methods on their scope of accreditation, covering method validity, equipment calibration and reporting [16]. It is worth checking that the HPLC method on a report is on the laboratory’s scope.
- Labels. The Therapeutic Goods Administration (TGA) has stated that a “research use only” disclaimer does not make supply lawful, change regulatory status, permit importation, or remove advertising or supply obligations [17]. A chromatogram is evidence about one batch; it does not change any of this.
This is general information, not legal advice. Laws change; check the current Poisons Standard and TGA guidance.
Frequently asked questions
What does retention time mean on an HPLC chromatogram?
It is the time from sample loading to the top of a peak. Under fixed conditions each compound has a characteristic retention time, but different compounds can share one [1].
How is HPLC purity calculated?
Usually as the main peak’s area divided by the total area of all integrated sample peaks, times 100. Accurate figures need correction for impurities that absorb differently from the main peptide [1, 2].
Why do two laboratories get different purity for the same batch?
Column, gradient, wavelength and integration settings all change how peaks separate and are counted. Different integration of the same data can shift purity by close to a percentage point [5, 8].
What is a ghost peak?
A peak that comes from the system rather than the sample, for example from contaminated solvent or gradient mixing problems. Running a blank reveals it [12].
Does one sharp peak prove the peptide is correct?
No. A single peak shows the sample looks homogeneous under those conditions; identity needs a mass or another orthogonal test [9, 14].
References
- The Japanese Pharmacopoeia, 18th edition (English version). General Tests, Processes and Apparatus: 2.01 Liquid Chromatography. mhlw.go.jp. Accessed 25 October 2026.
- International Council for Harmonisation. ICH Q2(R2): Validation of analytical procedures. Adopted 1 November 2023. database.ich.org. Accessed 25 October 2026.
- Kuipers BJ, Gruppen H. Prediction of molar extinction coefficients of proteins and peptides using UV absorption of the constituent amino acids at 214 nm to enable quantitative reverse phase high-performance liquid chromatography-mass spectrometry analysis. J Agric Food Chem. 2007;55(14):5445–5451. doi:10.1021/jf070337l. PMID: 17539659
- D’Hondt M, Bracke N, Taevernier L, et al. Related impurities in peptide medicines. J Pharm Biomed Anal. 2014;101:2–30. doi:10.1016/j.jpba.2014.06.012. PMID: 25044089
- Enmark M, Örnskov E, Forssén P, Samuelsson J, Fornstedt T. Peak integration errors and analyst interaction in pharmaceutical quality control using LC-UV. J Pharm Biomed Anal. 2026;283:117740. doi:10.1016/j.jpba.2026.117740. PMID: 42810098
- Kumar Kuril A. The critical need for implementing RRF in the accurate assessment of impurities in peptide therapeutics. Anal Chem. 2025;97(24):12480–12485. doi:10.1021/acs.analchem.5c02149. PMID: 40499007
- McCarthy D, Han Y, Carrick K, et al. Reference standards to support quality of synthetic peptide therapeutics. Pharm Res. 2023;40(6):1317–1328. doi:10.1007/s11095-023-03493-1. PMID: 36949371
- Forssén P, Fornstedt T. Accuracy of methods for integrating overlapping chromatographic peaks: a systematic evaluation. J Chromatogr A. 2026;1787:467393. doi:10.1016/j.chroma.2026.467393. PMID: 42705016
- European Medicines Agency. Guideline on the development and manufacture of synthetic peptides. EMA/CHMP/CVMP/QWP/367182/2025. Adopted 4 December 2025; effective 1 June 2026. ema.europa.eu. Accessed 25 October 2026.
- Åsberg D, Langborg Weinmann A, Leek T, et al. The importance of ion-pairing in peptide purification by reversed-phase liquid chromatography. J Chromatogr A. 2017;1496:80–91. doi:10.1016/j.chroma.2017.03.041. PMID: 28363419
- Mant CT, Chen Y, Yan Z, et al. HPLC analysis and purification of peptides. Methods Mol Biol. 2007;386:3–55. doi:10.1007/978-1-59745-430-8_1. PMID: 18604941
- Williams S. Ghost peaks in reversed-phase gradient HPLC: a review and update. J Chromatogr A. 2004;1052(1–2):1–11. doi:10.1016/j.chroma.2004.07.110. PMID: 15527115
- Mitulović G, Stingl C, Steinmacher I, et al. Preventing carryover of peptides and proteins in nano LC-MS separations. Anal Chem. 2009;81(14):5955–5960. doi:10.1021/ac900696m. PMID: 19537771
- Lian Z, Wang N, Tian Y, Huang L. Characterization of synthetic peptide therapeutics using liquid chromatography-mass spectrometry: challenges, solutions, pitfalls, and future perspectives. J Am Soc Mass Spectrom. 2021;32(8):1852–1860. doi:10.1021/jasms.0c00479. PMID: 34110145
- Therapeutic Goods Act 1989 (Cth), section 3: definitions of “standard” and “default standard”. Federal Register of Legislation. legislation.gov.au. Accessed 25 October 2026.
- National Association of Testing Authorities, Australia (NATA). Laboratory accreditation: ISO/IEC 17025. nata.com.au. Accessed 25 October 2026.
- Therapeutic Goods Administration. Understanding your responsibilities when importing, compounding and supplying unapproved peptide products. Safety advisory, 13 April 2026. tga.gov.au. Accessed 25 October 2026.